Are there a secret patterns on charts? - Harmonic Trading

Few years ago I read book of Scott M. Carney about harmonic trading. I do not remember a lot, just that I was fascinated with the idea of hidden market patterns. Wouldn't it be great to know when the price will change direction and how far the range of movement will be – all the reversal points.
What a harmonic pattern is?
Most commonly known harmonic pattern are based on 5 points formation schema. Points are traditionally marked with letters XABCD. In this schema each point is a local price reversal point, so it’s a set of local highs and lows. Each formation has it’s specific size described by relation between price moves between points. Idea of such formation was first time proposed in H.M. Gartley's book "Profits in the Stock Market" around 1935. Its first name “Gartley 222”, was created by book author surname and page number 222 on which formation was described, but now it’s commonly known as “Gartley”.
Gartley is described by relations:
BA/XA = 0.618
(CB/AB = 0.382 and DC/BC = 1.272) or (CB/AB = 0.886 and DC/BC = 1.618)
DA/XA = 0.786
Expected reversal points is at 0.618-1.27 XA
Values used in formations are Fibonacci ratios.
What are Fibonacci ratios?
To answer that question we should start from Fibonacci sequence. The Fibonacci sequence is a series of numbers in which each number is the sum of the two preceding numbers. The sequence starts with 0, 1, 1, 2, 3, 5, 8, 13, 21, 34, 55, 89, 144, 233, 377, 610 and so on. The sequence is closely related to the golden ratio (1.618), which is a mathematical concept that appears in many natural phenomena, such as the spiral patterns of shells and the arrangement of leaves on a stem.
Fibonacci Ratios are derived of that sequence. By [N] I mean n-th element of the sequence.
The bigger numbers you will take from the sequence the more precise ratio you will get:
0.618 = 377/610 or 233/377 – It’s [N]/[N+1]
1.618 = 610/377 or 377/233 – It’s [N]/[N-1]
0.382 = 233/610 – It’s [N]/[N+2]
2.618 = 610/233 – It’s [N]/N-2]
Now based on those values we can get more:
0.786 = square root of 0.618
1,272 = square root of 1.618
0.886 =square root of 0.786
1,128 = square root of 1.272
Fibonacci ratio are often used in technical analysis, e.g. to determine the range of price corrections.
Taking Gartley’s idea into pieces we have 5 point XABCD formation and 8 Fibonacci ratio values. It give us 4K combinations. Gatley formation is a subset of two of them.
Since we have so many combinations and only 2 are used, maybe there are other sets?
Of course, many lovers of the Gartley idea began to choose other combinations of XABCD formations. Some of them you can find under names: Bat, Alt bat, Leonardo, Butterfly, Crab, DeepCrab, Swan and there will probably be more in the future, creating them can be done by picking subset from this 4K set. If we relax some relations by using ranges instead of values than number of combinations will increase quite fast.
Going further, we can change the relationship describing the formation. Gartley compared subsequent points of the formation: XAB, ABC, CBD and XAD, but nothing prevents you from comparing price moves in the same direction (every 2nd price move: XAC, ABD) or any other combination like XCD. We can also change the number of formation points to: 4 - ABCD or 6 – XABCDE. We are limited by our imagination.
How to use the idea of harmonic patterns in trading?
There are probably many ways, but I will describe 2 that I have encountered:
1. We are looking for a formation and using move from D point to some take profit point. In the internet you can find propositions of take profit value with proportion to formation. In this approach D or some margin below/above D is our stop loss value.
2. We are looking for formations that are not formed yet, and using move from C to D. C or some margin below/above C is our stop loss value and D is out take profit point.
TradingView implementation
My implementation of both approaches is available as Harmonic package.
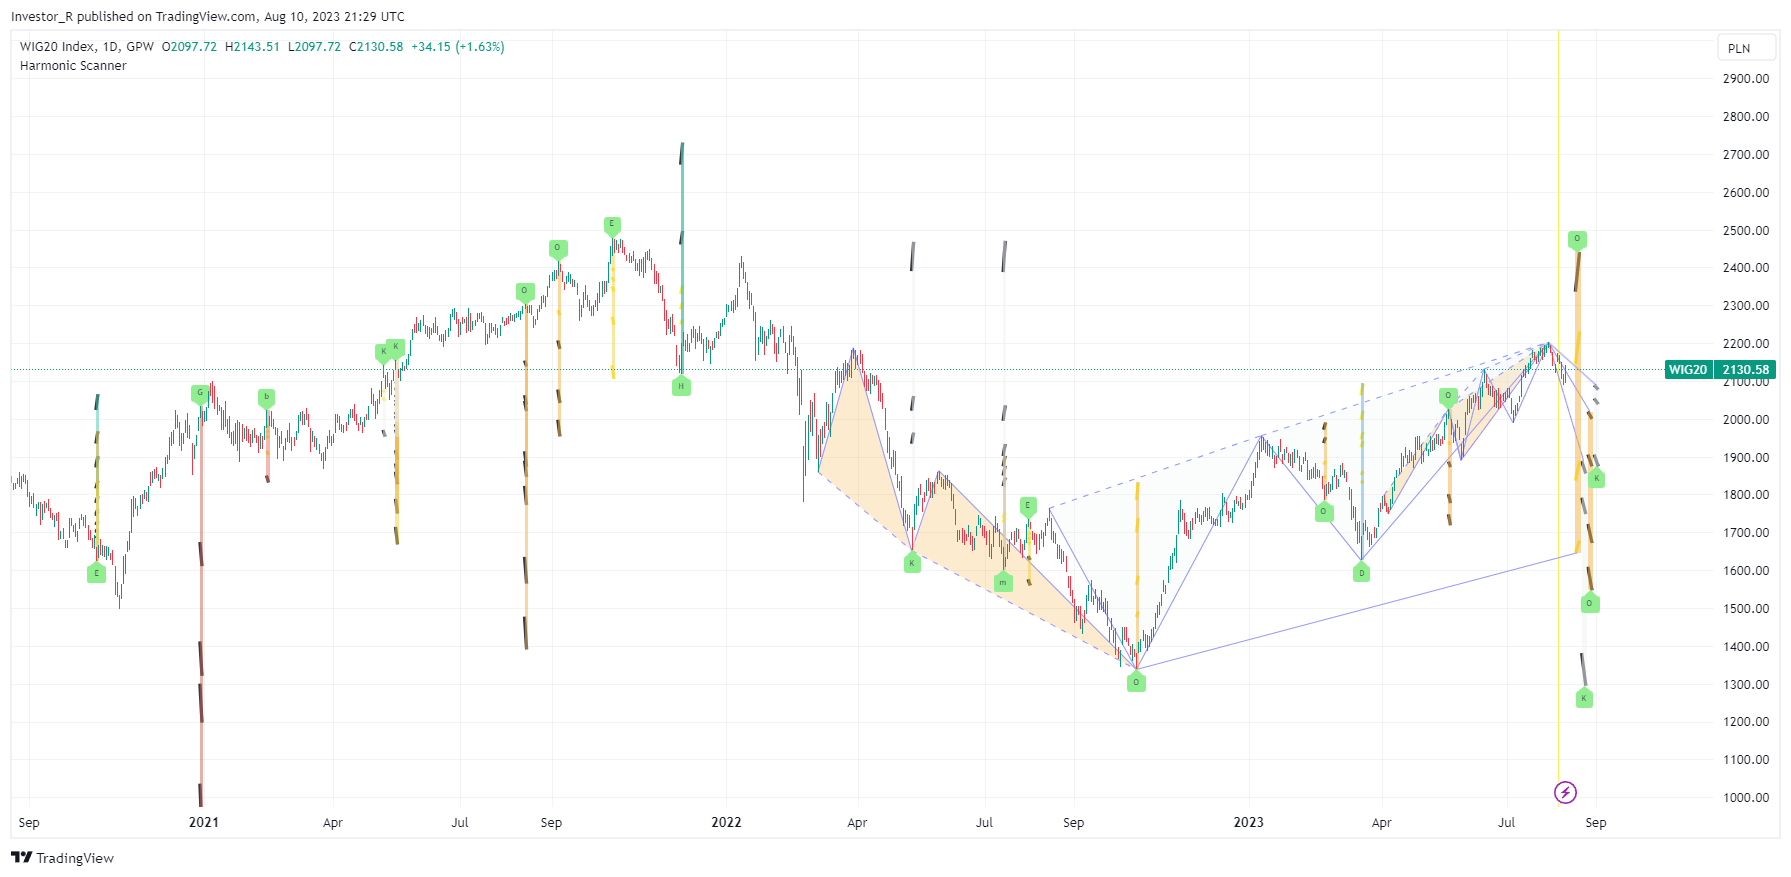
Harmonic Scanner is looking for harmonic patterns and calculates effectiveness of particular formations with different take profit points.
Harmonic Predictor is looking for ongoing formations and calculates effectiveness of trading price move from C to D
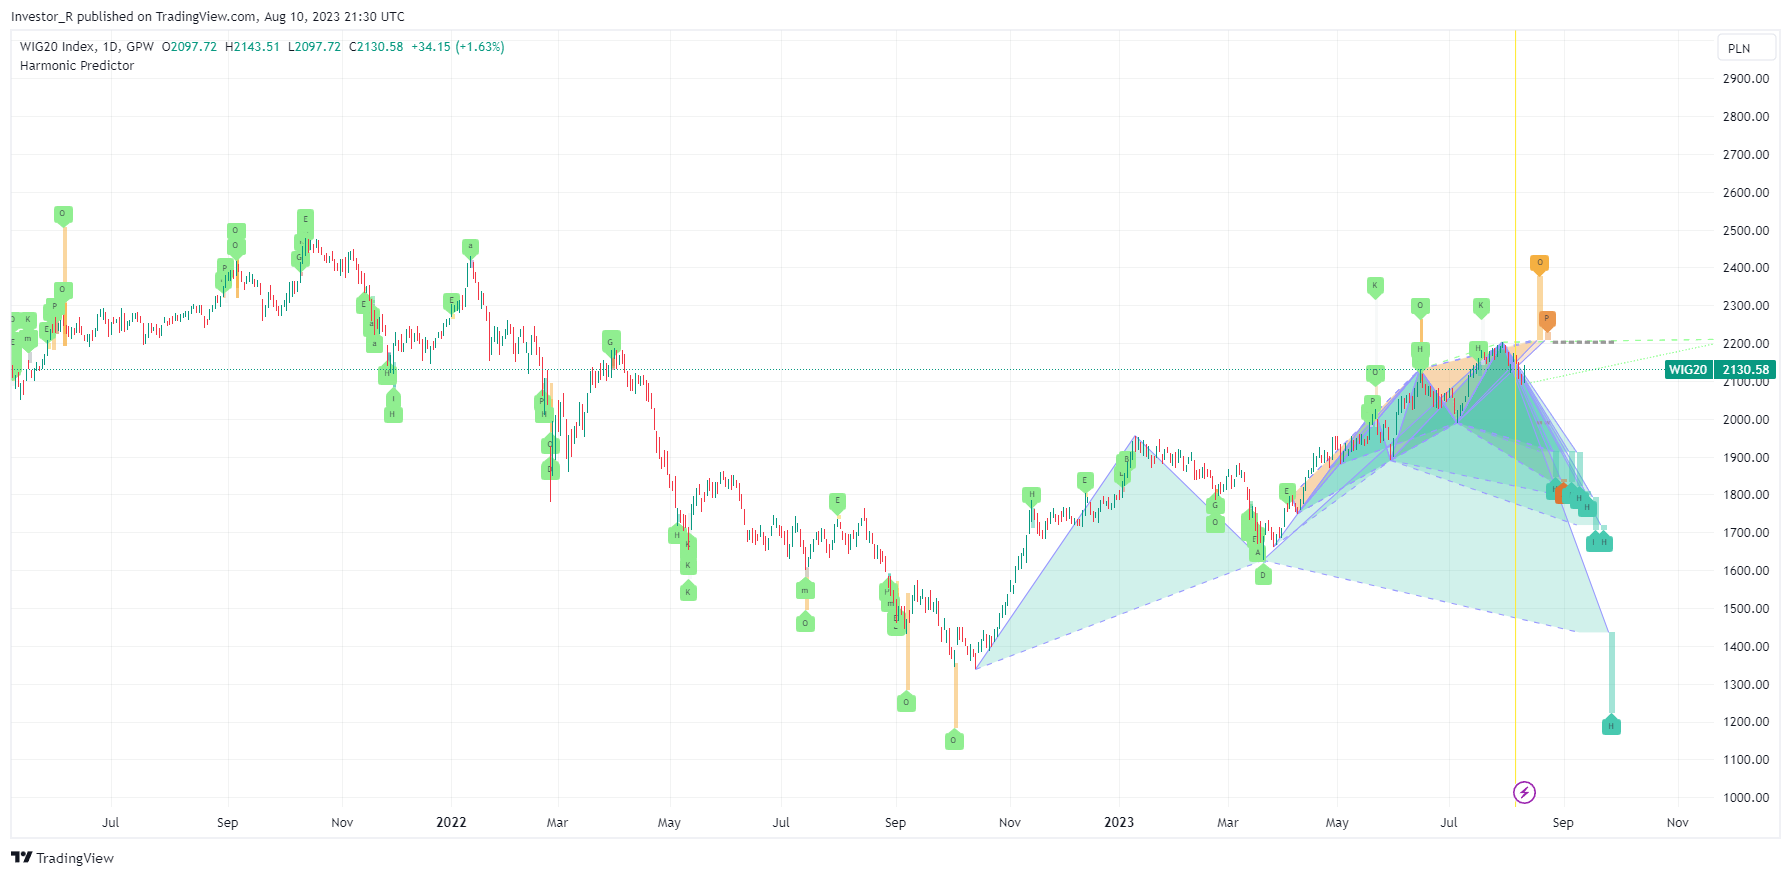
Both scripts have been predicting declines on the Wig20 for several days. Index is moving in this direction and we'll see what future
Package is with free 14 days trial, to get it, just write on: toolkit4trading@proton.me
Personally, I'm not a fan of this type of approach. With a sufficiently large capital, you can both draw and break any pattern on the chart. Interestingly, both scripts have been forecasting declines on the Wig20 for a few days, and the Index is moving in this direction.
Have a nice day and good luck in trading!
Ps. If you judge the issues differently or you just want to give 5 for the work I do, write to toolkit4trading@gmail.com