Price-volume analysis on TradingView

Recently, I spent a lot of time on the topic of volume-price tools to better understand current market situation. Naturally, I ran into the problem of data representation, accuracy and TradingView limitations.
Trading View is highly optimized for candle charts and do not provide single transactions/orders data.
According to Trading View documentation, candle data are provided with the smallest interval of 1 second. This means, the batch of transactions that took place within a second is aggregated to 5 values describing the candle (open, low, high, close, volume). In simplest case, this means that each second of trading of each instrument on the market is represented by 5 values.
Is that a lot?
I do not found information about storage system, so I would do some simple assumption:
5 value, 4 bytes each, gives 20 bytes per second (candle). In 1 hour we have 3600 seconds, what give us:
· 72kB/h
· 576 kB /8h session,
· 1728 kB/day of continuous trading
· ~631 MB/year of continuous trading.
If you multiply it by the number of instruments and exchanges (crypto currency can be traded on many exchanges and have different price and chart on each of them) than you will notice how big storage it needs and how high bandwidth is needed to synchronize data transfer between so many sources and millions of users. From my perspective, Trading View does it well in most cases.
The aggregation (batch of transactions into candle) described above is generally irreversible. With 1 or 2 transactions, we can estimate what has happened, but with thousands of transactions done in 1 second it’s impossible. Unfortunately nowadays most of the trading is done by machines. Computer need milliseconds to analyze situation and make transaction. I’ve seen 1s weak going few k$ down on BTC (Sell by market with a low liquid order book). What we can say based on such candle? Only that X volume was traded between high (A) and low (B), and finally the price has closed at C. For some applications it will not matter whether most of the volume was traded at candle high or low. Technical analysis will draw line in the same places, but for the buyer entry price defines his strategy and exit price, so it influence the whole market.
Some of you may ask:
“Wait, it there is no precise price-volume relation, that how the Volume Profile tool available on TradingView works?”
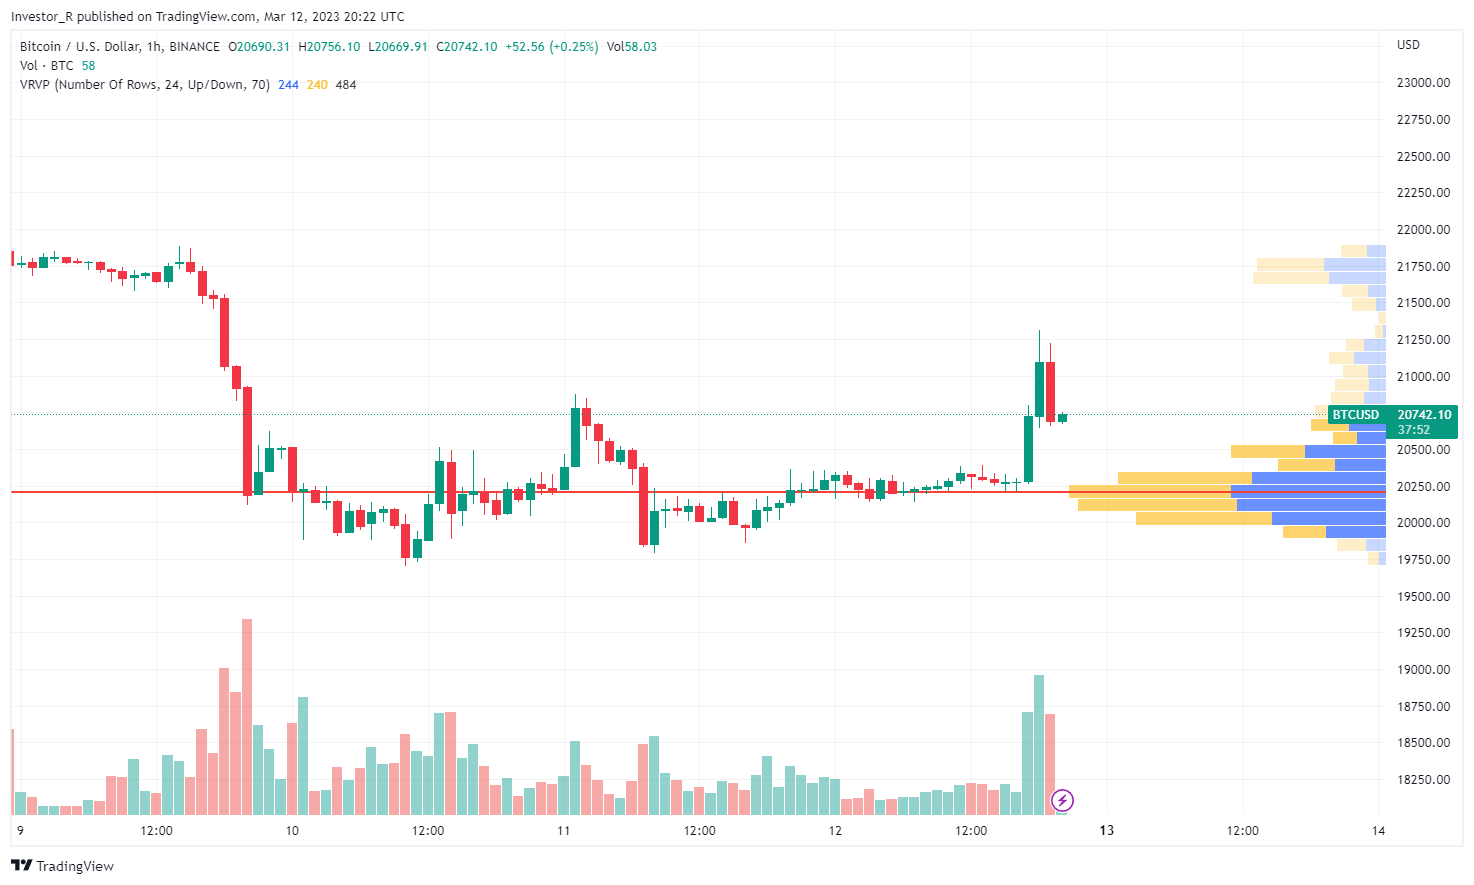
Well, it assumes that the volume is uniformly distributed over the entire candle. It’s a reasonable assumption but only approximates the reality. Missing of transactions/orders data is the reason why all tools based on price-volume relation are on TradingView only approximations.
Is it bad?
It depends on the use case:
· In classic technical analysis, volume distribution inside the candle is ignored. Price and chart shapes are of primary importance, which is why players with large capital can modify the chart to evoke behaviors motivated by technical analysis.
· Volume Profile aggregates volume by price in a similar way and although the slot boundaries will not exactly coincide with the aggregated data in the candlesticks, it will usually be noticeable only after a close look and statistically should not have a big impact on determining the POC or the area of increased volume.
· With order flow approximation based on historical candles can work quite well for instruments with few trades per minute (e.g. stock with low liquidity). For markets with high frequency trading, I was testing few approximation techniques and results were significantly different from the real order flow.
Can it be better?
Keeping track of every single transaction with thousands being executed every second would quickly block even widest links. The solution would be aggregation optimized for volume-price analysis, but there are some technical issues to solve here. The first is the height of the slot. Various assets are listed on TW, let's compare 2 of them:
| BTCUSDT | COSBTC | |
|---|---|---|
| Price | 23350 USDT | 0.00000033 BTC |
| Smallest price change | 0.01 USDT | 0.00000001 BTC |
| last candle height | 150 USDT | 0.00000001 BTC |
I deliberately chose 2 extreme cases, Bitcoin with a price and volatility reaching thousands of dollars, and a cryptocurrency valued in bitcoin whose price is important in the 8th decimal place. It is quite obvious that the use of 1 slot height value is not an option here. However, a fairly natural choice is the smallest change in price. Let's check on the example of the last candle how much data would be required to apply this idea.
For COSBTC volume would be represented by 1 value.
For BTCUSDT it would require 15000 (150$ splited into 0.01 USDT slots = 150 * 100) values. 15000 times more data for only one candle. I know that this is the worst case. In practice price is moving for more than 1 thick, so many price slots would have 0 values and we can code group of such values with just 1 value in the stream. I will stop here, without access to the real data I’m not able to estimate it more precisely.
Aggregating the volume into slots with the height corresponding to the smallest price change, although ideal for order flow analysis and all tools based on the volume-price relationship, is unlikely to be implemented by TW due to its low scalability.
Is there another way?
Let's take a look at the documentation of Pine script execution model. In the "Calculation based on historical bars" section, we find confirmation that for historical data, each candle is described with only 5 values. However, in the "Calculation based on realtime bars" section, things get more interesting:
“The most important difference between execution of scripts on historical and realtime bars is that while they execute only once on historical bars, scripts execute every time an update occurs during a realtime bar.”
If each performed transaction means a data update, we can reconstruct completed orders list by comparing subsequent changes. Sounds like, limited only to real time data, but a good solution to all our problems.
I have prepared the script "OrderFlow register", which reconstructs the list of orders on this basis.
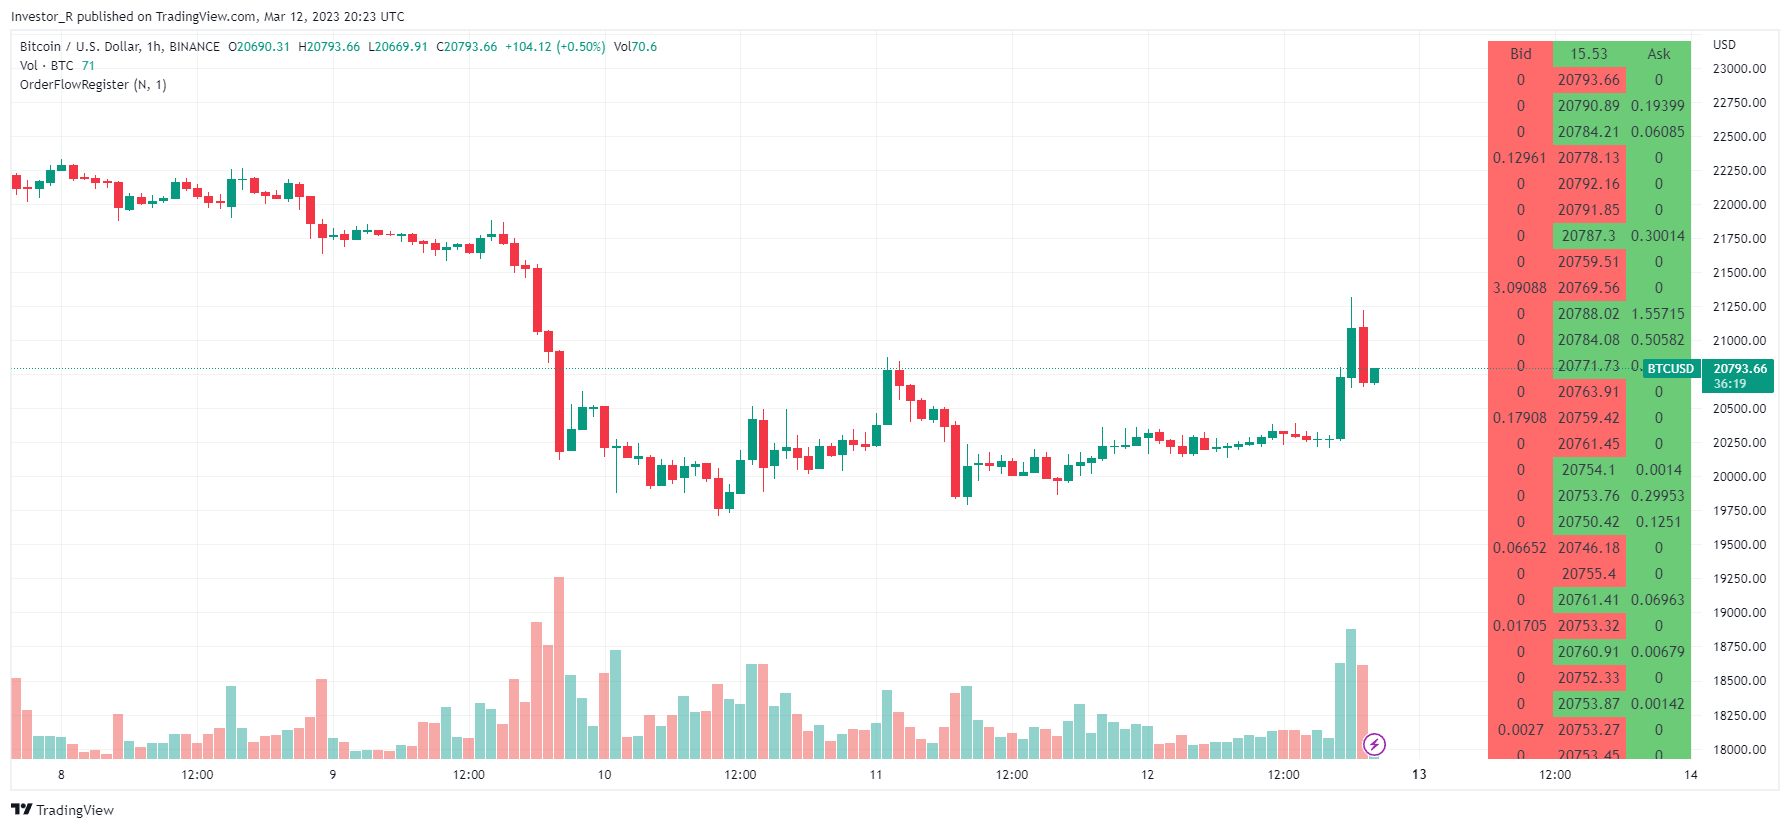
Unfortunately, the documentation is misleading and we hit few TradingView limitations.
Under the most favorable conditions, the script gets up to 20 updates per second. If you run it few times each copy will get different update (in different time). As a result, it is not possible to reconstruct the list of orders, and repeated scripts do not produce consistent, stable results.
Unfortunately, as the complexity of the script increases, its execution time increases and the number of updates decreases quite rapidly. I do not limit myself to simple solutions, so this is a highly undesirable dependency. `Also working during peak trading hours (e.g. after opening the session) on high trading assets was difficult or impossible. Script can hand (not update even though chart is drawing price updates and candle changes) or not draw anything with the message “Internal server study error”.
I tested several approaches and finally decided to pause all development work on the Order Flow package. TradingView has many limitations and providing a solution that works correctly for each asset is beyond the capabilities of the TradingView platform. I hope that this will change one day.
Have a nice day and good luck in trading!
I made a mistake or You know a better solution? You judge the issues differently or you just want to give 5 for the work I do, write to toolkit4trading@gmail.com